The market is still contracting, but it’s at a steadily decreasing rate – and non-residential tender enquiries are actually growing. Experian Business Strategies fills in the details
01 / The state of play
Since its low of 33 in December 2008, the trend in the activity indicator has generally been an upward one. The uptick in May was particularly encouraging, with the index rising by five points to 43 (its highest level since April 2008), but since its value remained below 50, it still did not represent an improvement in activity but a slowdown in the rate of contraction.
For the same month, the activity indices for all three sectors improved from the previous month. The civil engineering and non-residential activity indicators made particularly large gains, with the former showing an increase of 11 points to 40 and the latter a rise of seven points to 45. The increase of the residential activity index was a more modest two points, which brought it to 42.
The tender enquiries index for the non-residential sector increased 11 points in May to 58. In contrast, the index for the residential sector fell by two points to 46, and civil engineering dropped one point to 47.
Having hit an all-time low of 23 in January, the employment prospects indicator continued its steady climb in May with an increase of 4 points to 36. Despite the rise in the index, employers continued to express their intentions to keep reducing staff numbers over the next three months.
02 / Leading contruction activity indicator
(See graphic attached)
03 / Material costs
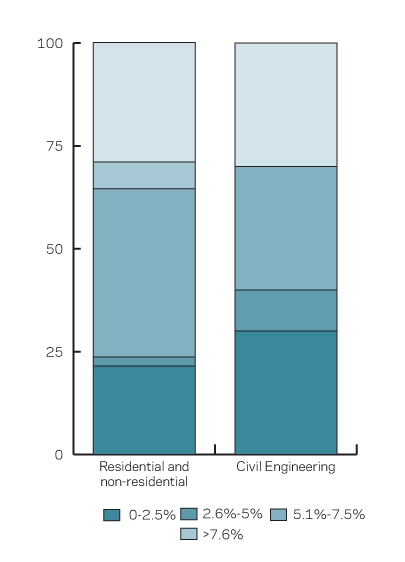
In May, the number of residential and non-residential firms reporting a fall in material costs increased slightly from three months ago to 22%. For the same month, almost 41% of firms in the building sector experienced material cost inflation of between 2.6% and 5%, and 29% saw a rise of more than 7.6%. Seven per cent of survey participants active in the two sectors reported an increase in material costs of between 5.1% and 7.5%, but only 2% saw a rise of less than 2.5%.
On the civil engineering side, 30% of firms experienced a fall in material costs, whereas the same amount reported an increase of more than 7.6%. Interestingly, a further 30% of respondents in the civil engineering sector said material costs increased by between 2.6% and 5% from a year ago, and 10% felt that the increase had been less than 2.5%.

04 / Regional perspective
With an increase of five points, East Anglia climbed past the 50 mark to 53 in May to make it the only region to see a rise in its construction activity level. This took the index for the region to its highest point since August last year.
Both the East Midlands and Northern Ireland increased by three points to take their respective indices to 41 and 44. The rise for Northern Ireland took the index to the same level it reached in June 2008.
At 41, the index for Yorkshire and Humberside rose by one point, and although Scotland’s index also reached the same level (41), the nation experienced a one point drop rather than an increase.
Of the 11 regions, the South-west was the only one not to see a change in its index, remaining at 38.
The UK indicator, comprising responses from firms operating in more than five regions, showed a one point increase in May to 43. This took it to the highest level since the final month of 2008.
Experian Business Strategies’ regional composite indicators incorporate current activity levels, the state of order books and the number of tender enquiries received by contractors to provide a measure of the relative strength of each region’s industry.
(See graphic attached)
Downloads
02 / Leading construction activity indicator
Other, Size 0 kb04 / Regional perspective
Other, Size 0 kb
Postscript
This an extract from the monthly Focus survey of construction activity undertaken by Experian’s Business Strategies division on behalf of the European commission as part of its suite of harmonised EU business surveys. The full survey results and further information on Experian Business Strategies’ forecasts and services can be obtained by calling 0870-1968 263 or logging on to
The survey is conducted monthly among 800 firms throughout the UK and the analysis is broken down by size of firm, sector of the industry and region. The results are weighted to reflect the size of respondents. As well as the results published in this extract, all of the monthly topics are available by sector, region and size of firm. In addition, quarterly questions seek information on materials costs, labour costs and work in hand.


No comments yet