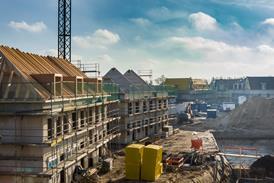
The latest came out today and, with the exception of the housing minister Grant Shapps, they seem almost universally to have been greeted with great concern.
To put it bluntly, they’re awful.
This was despite a major upward revision which increased the numbers recorded as being built from 2007 to the present.

The bald data suggest the number of homes built (not seasonally adjusted) in the first three months of this year was 31,420, compared with 29,530 in the same period a year ago. That looks promising.
But recorded starts dropped from 29,070 to 23,810. That’s a disaster if we are looking to boost the number of completion in the future.
And for the social sector things look even worse with housing association starts at 3,820 in the first quarter. That’s the lowest number since late 2003.
Naturally Mr Shapps found an upside in the data. He tweeted: “New housebuilding figures show housing starts in 2011 were up 29% on 2009 >”
But if we stand back and look at the data in a more serious light we see just how awful the situation is from a construction point of view.
The first graph (above) shows the 12-month rolling total of housing starts and completions in England. It shows the bounce back in starts as house builders restocked their production pipelines. It shows a hint of an increase in completions.
But given that starts are now falling, it is a fair surmise that this increase in completions may be short-lived.

Then let’s look at the challenge. The next graph (above) is one I’ve used before but updated for the revisions. It is worth providing a slight word of warning here. There may be some slight undercounting in the data in a few of the years before 2007.
Anyway, to explain, Grant Shapps set himself a target (see ) which he described as the Gold Standard by which he would be judged. This target was for this Government to hit the pre-recession level of house building. This is shown on the graph as a black dotted line.
The target was obviously less ambitious than that set by Labour in 2007, which is also show (green dotted line). But fair play to him it was a tough challenge in the new circumstances.
To the graph I have added in the latest forecast growth for house building from the Construction Products Association. I have used the GB figure for the growth rate as the association doesn’t forecast for England alone.
From this, it seems pretty clear that without a huge boost Mr Shapps is likely to fall well short of his aspirations. By 2015 when the Government comes to an end (assuming a full term) the gap between the 176,650 peak year and what is forecast by the Construction Products Association will be greater than 40,000.
Forecasts are more often wrong than right, because circumstance can change markedly from when the prognosticators seek to read the runes. Policy can change unpredictably.

So to look at things another way here is a graph (above) showing the historic relationship between the number of residential property transactions overall and number of new homes built. It has been pretty stable at about one to ten for many years.
Now even if we accept the predictions for transaction (dotted blue line) made by the Office for Budget Responsibility, which are compared with many forecasts very optimistic, we see the level in 2015 well below that of 2007.
So if this relationship continues to hold it seems unlikely that we will see the surge needed in private sector house building to get Mr Shapps close to his Gold Standard.
Naturally the NewBuy scheme could skew the relationship in favour of new build. But the scheme does appear to have got off to a rather shaky start. We shall see.

Now let’s look at the picture regionally and quiz the fourth graph (above). London clearly is closest to the 2007 peak level of completions (13.6% down on a 12-month rolling total measure), while the rest of the South has performed far stronger than the rest of England. The South from these figures (confirming what we know) seems to have offered most support to the house building industry.
But the South is where it’s toughest to get planning permissions. So the question is will these regions continue to deliver growth.
The next graph (below) suggests probably not. It shows that in the period under Mr Shapps as housing minister London housing starts on a 12-month rolling total basis have fallen across the South. Meanwhile house building completions in the South East and Eastern regions have fallen on his watch, although they have started to pick up a shade of late.

These graphs can be misleading, but they do challenge, as does most data, the view that Mr Shapps will hit his Gold Standard. That is unless he or others can summon up a huge boost in funding for house building.


No comments yet