ExperianŌĆÖs Business Strategies division looks at what happened to the industry at the end of 2009, which makes for grisly reading ŌĆō but there were some star performers, and things are looking up ŌĆ”
01 / overview
Construction output in Britain was ┬Ż97bn in 2009 (in 2005 prices). This was 11.5% lower than 2008 and the weakest annual outturn for eight years. Performances varied greatly across the sectors, ranging from a 34% contraction in industrial output to growth of 27% in the public non-residential sector. However, not unsurprisingly, growth was the exception rather than the rule, with the infrastructure (10%) and public housing sectors (0.8%) the only others where output increased during the year.
In the fourth quarter of 2009, quarter-on-quarter output declined by 1%, following a 2% rise in the third. Although it was the R&M sectors that were mainly responsible for growth in the third quarter, new work rose by 5% in the fourth. Quarterly growth was recorded in all new work sectors, with the exception of commercial.
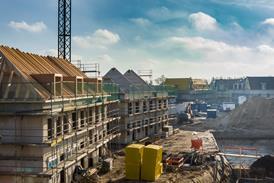
The Homes and Communities AgencyŌĆÖs Kickstart delivery programme, which is intended to get stalled residential projects back into gear, gathered steam towards the end of the year. Allocations for the first round of funding were made in September and work began on a number of sites shortly after. After double-digit quarter-on-quarter growth in the third quarter of 2009, output rose a further 14% in the three months to December, making the quarterly outturn the highest for 19 years. The shortlist for the second round has now been announced, with work due to start on these sites over the coming 12 months.
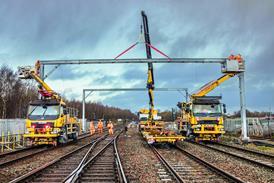
The infrastructure sector remained buoyant in the final quarter of the year, with output rising by a further 15%, quarter on quarter. Work continues on a number of schemes, including the M25 widening project, the Thameslink upgrade and Crossrail.
The public non-residential R&M sector saw the weakest contraction of the R&M sectors, with output falling 2.9% during the year. Anecdotal evidence suggests that public sector bodies were ensuring that their 2009/10 budgets were fully spent in light of the inevitable spending cuts. Output in the private housing RM&I sector declined 12% in 2009, as uncertainty over job security weighed on consumer confidence. Most homeowners continued to put off non-essential RM&I work, such as the cyclical upgrading of bathrooms and kitchens. These big-ticket items may go ahead once the economic recovery has bedded down.
Although a number of sectors have improved in recent quarters, the outlook for construction remains muted in the short term. There is, of course, also the added uncertainty of what will happen after the general election, with the timing of spending cuts largely unclear.
02 / new work output
See graphic 2
03 / R&M output
See graphic 3
04 / new work orders
See graphic 4
05 / 2010-12 forecast
See Graphic 5
The chart presents sectoral forecasts for 2010 to 2012. The weakest outlook is for the commercial sector where output in 2012 is forecast to be 6% lower than it was in 2009 ŌĆō the only sector where this is the case. Following a double-digit decline this year and a further contraction next, growth will return to the sector until 2012, once demand for office, retail and leisure space has returned. The prospects for the infrastructure sector are much rosier, with a number of large projects either on site or planned over the period to 2012. Recovery is expected in the private housing sector this year and it will gather steam over the forecast period.
06 / regional new work output
See graphic 6
New work output declined across all 14 regions and nations in the final quarter of last year. NE saw the strongest rate of decline, with output contracting 30% from a year earlier. Output also declined at double-digit rates in S, NW, WM and LON. At the other end of the scale, the pace of decline was weakest in W and EA where output fell 4% and 5% respectively.
07 / regional R&m output
See graphic 7
NE was the only region not to see a contraction in R&M output in the final quarter, although the rate of growth was negligible at 0.4%. There was a moderate decline in BED (2.5%), and output contracted 5.9% and 6.3% in LON and EA respectively. The worst performing regions were YH (ŌĆō20%), EM (ŌĆō17%) and WM (ŌĆō16%).
08 / regional new work Orders
See graphic 8
There was substantial regional variation in the new work orders in the quarter, as new orders increased in six compared with the previous year. At one end of the scale new orders jumped by 64.6% in YH and by 58.2% in WM, whereas at the opposite end, they contracted by 37.4% in W and by 32.8% in KNT.
Downloads
Graphic2: New work output
Image, Size 0 kbGraphic3: R&M output
Image, Size 0 kbGraphic4: New work orders
Image, Size 0 kbGraphic5: 2010-12 forecast
Image, Size 0 kbGraphic6: Regional new work output
Image, Size 0 kbGraphic7: Regional R&M output
Image, Size 0 kbGraphic8: Regional new work orders
Image, Size 0 kb


No comments yet