The gloom continues for construction, though there are more signs that the infrastructure and non-residential sectors are growing, says Experian’s Business Strategies division
01 / Overview
In the first six months of 2009, construction output fell to £47.8bn, 15% less than a year earlier. However, in the second quarter, output declined by just 0.5%, quarter-on-quarter. Orders in the first half of the year totalled £15.1bn, in 2005 prices, which was a decline of almost 27% on the same period of 2008. Again, there were some positive signs from the second quarter figures, with new orders at £8.5bn, 22% higher than in the first quarter of the year.
However, these figures continue to mask significant sectoral differences. The infrastructure and non-residential sectors are the two main growth areas; in the first half of the year, infrastructure output rose 4% and non-residential 22%, compared with the first half of last year. Although the ��ɫ����TV Schools for the Future programme has suffered substantial delays from the outset, a number of schemes have reached financial close and are now onsite.
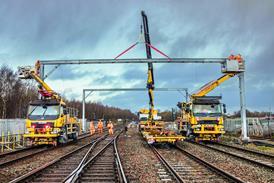
The infrastructure sector has been boosted by the beginning of work on the M25 widening project and a number of other large schemes, such as the Thameslink upgrade and the Felixstowe port expansion. Meanwhile, work is continuing apace on the Olympic park.
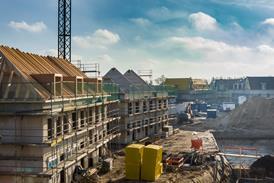
Output in the the public housing sector rose slightly in the second quarter of the year, potentially indicating that that market has bottomed out.
The commercial and industrial sectors continue to be crippled by the recession. Output in the commercial sector fell at an annual rate of 27% in the first half of the year, and new orders more than halved. A large number of office projects remain mothballed and delayed as developers wait for real signs that the economic climate is improving.
On the industrial side, output in the six months to June dropped 39% from a year earlier and orders plummeted by half. Manufacturers have been unable to capitalise on the weak pound as global demand has also been suppressed by the economic crisis. The sector has thus been hit by the double-whammy of weak international and domestic demand.
The situation has been bad for the repair and maintenance sectors as well – companies and individuals alike have been looking to cut any costs that they can, and this, more often than not, involves non-essential maintenance work; firms postpone the office revamp and homeowners decide that the five-yearly bathroom upgrade can be delayed.
The private non-residential R&M sector was the hardest hit. Output in the first half of the year declined by 20% year-on-year, and private housing output fell 12%. There were weaker declines in the public non-residential and public housing sectors.
There are still concerns that this may be a W-shaped recession – things may get worse before there are any sustained improvements.
02 / New work output
(See corresponding graph below)
03 / R&M output
(See corresponding graph below)
04 / New work orders
(See corresponding graph below)
05 / 2009-11 forecast
The chart (right) presents sectoral forecasts for 2009 to 2011. The infrastructure sector is expected to fare by far the best, with output in 2011 forecast to be 38% higher than in 2008 as work continues on Thameslink, on Felixstowe port and on projects in the Scottish transport investment programme, to name but a few. The public non-residential and public housing sectors are also expected to see overall growth, with output rising by 22% and 16%, respectively, over the forecast period. Private commercial output is predicted to drop by 37% between 2008 and 2011, making it the worst performing sector. The industrial sector is not too far behind, with a forecast decline of 35%.
(See corresponding graph below)
06 / Regional new work output
New work output continued to fall across all regions in the second quarter of 2009 and all, bar EA and LON, saw double-digit drops from the same period of 2008. The strongest decline was in WM (-28.9%), followed by EM (-26.6%) and declines of 25.7% and 25.6% in NW and NE, respectively. In contrast, EA experienced a fall of just 9.5%, while new work output in LON was 9.6% lower. With the exception of NW, rates of contraction eased from 1Q09.
(See corresponding graph below)
07 / Regional R&M output
R&M output declined in all 14 regions and nations in 2Q09. WM saw by far the strongest drop, with output falling 22.7% from a year earlier. NW and YH also experienced significant falls, with R&M output in the regions declining by 17.4% and 17.2%, respectively. At the other end of the scale, R&M output in SW was a negligible 0.2% down. BED and S were somewhere in between; output in S fell by 7.7% from 2Q08 and by 9.6% in BED.
(See corresponding graph below)
08 / Regional new work orders
BED, W and BRK were the only regions to see higher new orders in 2Q09 than in the same period a year ago. BED saw new orders jump 67.1% in the second quarter of the year, mainly as a result of higher infrastructure orders due to the M25 widening contracts being let. The increase in W was also strong, with new work orders rising 45%. In BRK the rise was a more modest 3.3%. The NE saw a 52.6% decline; the fall in S was 48.5%.
(See corresponding graph below)
Downloads
02 / New work output
Other, Size 0 kb03 / R&M output
Other, Size 0 kb04 / New work orders
Other, Size 0 kb05 / 2009-11 forecast
Other, Size 0 kb06 / Regional new work output
Other, Size 0 kb07 / Regional R&M output
Other, Size 0 kb08 / Regional new work orders
Other, Size 0 kb


No comments yet