All construction work output experienced a fillip in Q1 2019, while tender prices increased over the year at Q2 2019, marking the 24th consecutive quarter of tender price growth. Michael Hubbard of Aecom reports
01 / Summary
Tender price index ▲
Tender prices increased by 4.1% over the year at Q2 2019. This marks the 24th consecutive quarter of tender price inflation growth.
��ɫ����TV cost index ▲
A composite measure of building input costs recorded a 4% yearly rate of change in Q2 2019. Rising input costs continue to impact supply chain profitability.
Consumer prices index ▲
The annual rate of change remained at 2% in June 2019. As it is at its target rate, the Bank of England is less likely to change the bank rate, unless more economic stress arrives for the UK.
02 / Output and new orders
UK construction output
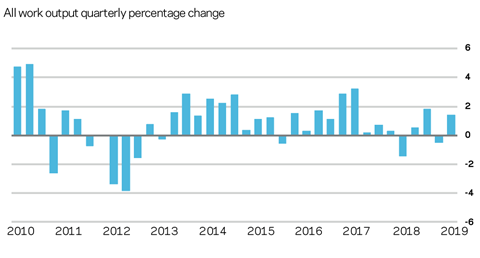
Construction all work output experienced a rally in Q1 2019 – both quarter-on-quarter and on the year measures. Current headline output levels equate with an industry that’s near its long-run average. More fundamentally though, especially given the backdrop, the key question is where the output trend heads now. Is the Q1 rebound sufficiently big enough to buck the trend that emerged out of 2018 and into 2019? Or is it a relief rally that is unlikely to materially adjust the underlying trend? One complication subsequently is that output growth fell by 1.3% in Q2 2019.
The hottest sectors in Q1 were public housing and infrastructure, posting growth north of 20% and 10% respectively over the year. Public sector housing is a comparatively small sector, but the infrastructure sector is considerable in size and this should provide a welcome fillip to overall industry workload. Private housing contributed to the growth picture, but not in the way it has continually logged significant additions to new work volume over recent successive years. Any marked changes to private housing would lead to clear a knock on to headline industry output.
New orders
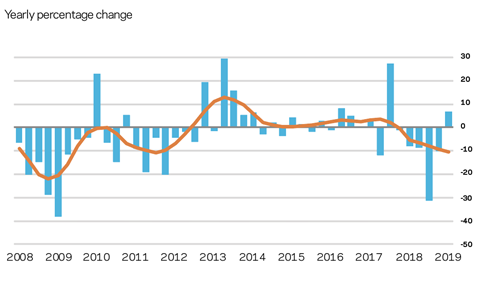
Similar to output, new orders for new work posted something of a rebound in Q1 2019. This followed a sub-par series of data prints through 2018. The accompanying upside is that this latest data provides some impetus once it eventually feeds into output. Whether this fundamentally adjusts the trend seen through 2018 remains a moot point though.
All sectors barring private housing posted solid quarter-on-quarter movements out of 2018 and into Q1 2019. The headline all new work new orders figure was up nearly 10% over the same period, and almost 7% over the year at Q1 2019. As with output, how will this data sit within the broader context of the industry’s current situation?
This year has seen an additional number of new projects on hold. A resolution to the UK’s political situation is anticipated to provide some additional impetus to workloads, as a result of the release of held projects to provide a “Brexit bounce”. For now, existing workload provides enough of a feeling that the industry’s wheels are turning, so short-term worries are marginally allayed. Further into the medium-term, anxiety persists.
03 / Activity indicators
Business sentiment
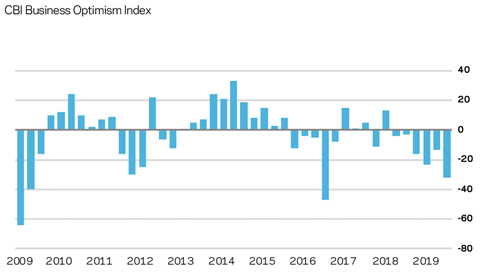
Business sentiment in the UK remains subdued while political and economic uncertainty are inescapably weighing on confidence. The CBI reports in its latest index summary that order books were below par, investment intentions are weaker and export orders declined at their fastest rate since the financial crisis. To complicate the domestic picture, recent developments with respect to international trade negotiations hit some turbulence again very recently. This was after tensions appeared to be resolving towards some resolution, with markets broadly mirroring this view. What can turn around the current domestic situation?
Commentators posit that the likelihood of a general election before the end of the year has increased. In reality, this might not immediately remove all of the prevailing uncertainty. However Brexit is resolved, at the very least, more clarity should emerge which aids the visibility in which paused projects are enabled to restart.
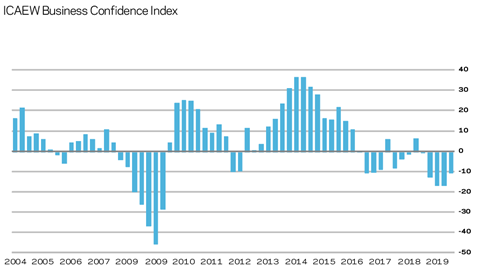
Confidence is also still subdued according to the ICAEW’s Business Confidence Monitor. Brexit shadows are a quasi-permanent feature affecting strategic and operational levels of a growing proportion of the supply chain. In fact, it will begin to extend through into necessary tactical responses as we approach the end of October. However, the ICAEW correctly points out that Brexit is not the sole reason for the UK’s current predicament – global economic conditions are slowing.
It is unfortunate that the UK is trying to resolve its Brexit conundrum at the same time as the global economic engine is moderating. Across the macroeconomic and industry data, there appear to be more downside risks to output than upside possibilities. Nevertheless, this conceals firm-level issues into the medium-term. For those managing the front end of projects and programmes, stakeholder complexity increases as the regulatory environment changes, evolves or invokes uncertainty. Risk management becomes ever more important, where it can provide mitigation.
04 / ��ɫ����TV costs
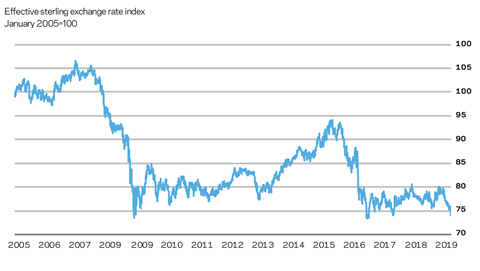
For almost a year, sterling has charted numerous short-term oscillations, driven largely by political news but without sustaining significant movements in any direction. However, sterling fell further in mid-July. This was driven largely by the prospect of a no-deal Brexit appearing to markets as more likely, following comments made during political hustings. This put £1 at $1.24, which marked a 27-month low. By way of reference, sterling reached $2.11 in November 2007.
At the end of July, a trade-weighted sterling index just dipped below its previous low, recorded after the EU referendum. On a spot basis against the US dollar, if sterling moves lower still – below the level seen after the EU referendum – then the next historical comparison nominally is market close on 26 February 1985. This period was more about US dollar strength though than perceived UK weakness. A lower currency can be beneficial in some areas. However, persistent currency weakness or heavy sell-offs and devaluation also signal that markets expect future turbulence or structural problems for the associated country.
Inputs
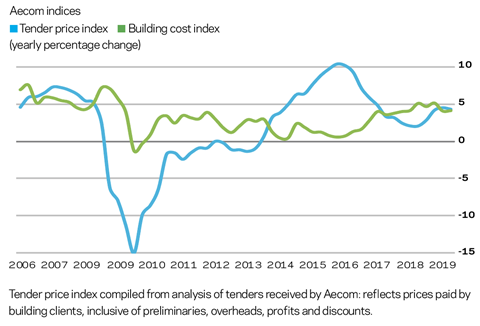
Aecom’s composite index for building costs – comprised of materials and labour inputs – rose by 4% over the year at Q2 2019. On the whole, the supply chain retains a firm view that materials and labour costs will likely increase further over the remainder of 2019. This is reflective of current workload, visibility of next immediate projects, ongoing difficulties securing trade resources and the commercial pressures experienced from sterling’s market valuation.
Forecasts of input cost inflation over the remainder of 2019 and into 2020 are at a lower headline rate of 3-4% though. Some inputs and components will run at rates higher than this, where localised demand and supply creates pinch-points. In the event of a no-deal Brexit, notable additional risks could materialise from non-tariff barriers. The time-related issues associated with or flowing from non-tariff barriers have the potential to adversely impact strategic and operational aspects of the supply chain. Ultimately, project delivery problems will follow, where suitable mitigation plans are not in place or activated, and if non-tariff issues are greater than initially assessed.
05 / Tender prices
Resources
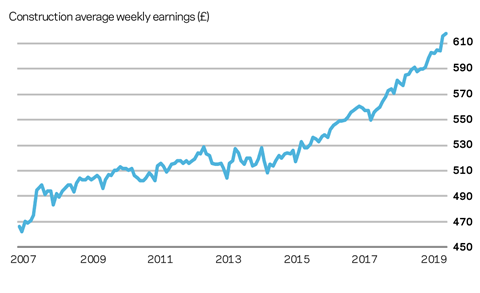
Capacity utilisation across the industry remains elevated, despite overall sentiment softening in recent months. A change in output trends would normally yield corresponding changes in capacity measures. However, a slower response to these labour market dynamics is indicative of a much tighter labour market than similar points in the market cycle previously.
In the main, an aggregate measure of wage rates for site labour at 4-5% growth over the year is still soundly above headline consumer price inflation in the UK. This continues the trend of strong wage growth on a real terms basis for the construction sector.
Commercial dynamics that exist across the industry – ongoing pressure from elevated input costs, recruitment pressures, assessment of risk, balancing price levels – add complexity to industry profitability. In combination, these conditions create issues that will flow into the next phase of the market cycle. In turn, they explain some of the reasons for the current run rate in tender price inflation and the expectations around future levels of pricing.
TPI forecast
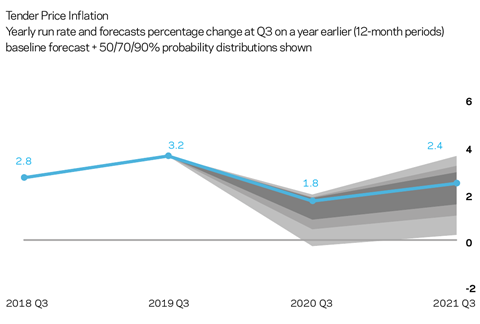
Tender prices increased by 4.1% over the year at Q2 2019, driven predominantly by elevated input cost trends. All drivers of inflation are contributing to the run rate but the dials are higher on resource inputs – labour and materials. Available work has placed a floor under market pricing until now, so prices have not been trimmed too much. Nor is there enough potential work to increase prices significantly, combined with higher emerging levels of price competition. But this summary masks important and illuminative market pricing signals.
Early works trades often provide the earliest indication of changing pricing sentiment and early works pricing in 2019 has indicated some softening in commercial sentiment. Aecom’s baseline forecasts for tender price inflation are 1.8% from Q3 2019 to Q3 2020, and 2.4% from Q3 2020 to Q3 2021. Assumptions underpinning the forecasts include output reverting to a long-run average without excessive volatility; elevated input costs as a result of weak if not weaker, sterling; resource constraints; an orderly Brexit arrangement generating positive risks from a synchronised release of held projects. Downside risks are linked to a disorderly Brexit process. Downside skew to the assessed risks accompanying the price forecasts results from sustained economic and political uncertainty.




No comments yet