Family spending data shows that growth in the home improvements market is being driven by retired people

Look at the TV ads that tease you to tart up your home and guess the age of the actors. I’d say from recent ads I’ve seen they tend to be young 30s to young 40s, with a few young-faced 50 and 60 year olds making it into ads promoting replacement windows. They seem a bit older than in ads of a few years ago, but from what I can make out, the message we have drawn from these ads over many years, and it still seems to hold true today, is that home improvements are things done by fairly youngish families.
Well that seems to be changing. Despite a fall in spending among families with two adults and kids, they remain the biggest cohort of spenders on home improvements on average. But the growth market is definitely retired folk if we believe the latest family spending data produced by the ONS.

The Family Spending data provide an annual stab at the weekly average amounts spent on various items and services for households across the UK.
The data include spending on “maintenance and repair of dwelling” and “alterations and improvements to dwelling”. Within this the data also highlight spending on “home improvements - contracted out”.
What is clear if we track the data back a few years is that the shift in spending patterns has been dramatic. I took a look at the changing level of spend in an earlier blog, but the really fascinating stuff lies in the detail and the way the recession has impacted on spending within different groups.
Because the data are pretty bouncy when finely sieved, I have looked at the change in spending by comparing the combined spending in the years of 2006 to 2008 with the years 2010 to 2012.
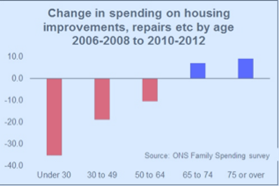
The top graph showing the change in spending on all home improvements, maintenance and repairs says a lot. The young are spending less the old more. Certainly younger households today are more likely to rent than in the past while more among the older folk own their own homes. But this change over the timespan shown will not be sufficiently great to shift the data as much as we see in the graph.
For firms who contract and or supply in this market the changing pattern of spending is important. The total spend in 2012 grosses up to about £33bn a year of which more than £18bn is contracted out. That’s a fairly sizable market.
Looking just at changing patterns in spending on contracted out work we can see how things have changed in the regions, by age, by socio-economic group, by income and by household composition.
So I’ve put a set of graphs together to illustrate these changes. Again, it must be remembered that the different groups will have different proportions of renters and homeowners, so this will influence the pattern of average spending.

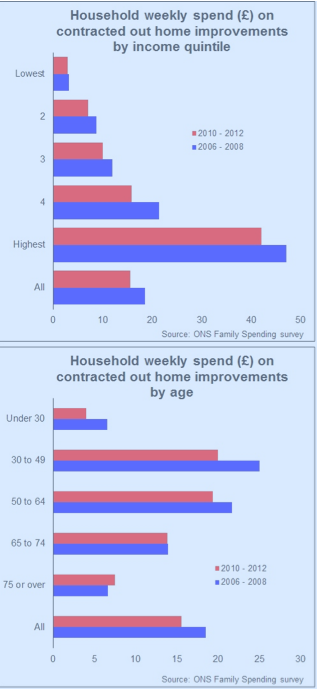
When we look at the spending by income group what is interesting is that all five groups have cut spending. The biggest proportional drop has been in spending by the fourth quintile income group. In fairness this tells us not a lot, except that those with bigger incomes spend much more, but probably not as much more than they did, on home improvement. But it is worth noting that a group of higher middle-income folk have cut spending more than the average.
The age of the household reference person is more interesting measure. As we saw earlier with the overall spend on home improvements the older are spending more and the younger

less on contractors to carry out the work.
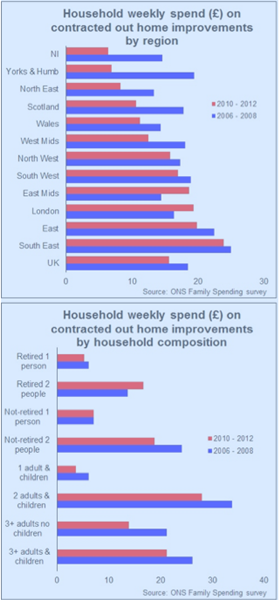
The regional story is also interesting, if not surprising. Households in London have increased their spending, in cash terms at least, on home improvement contractors while elsewhere it has been cut. What we see is a more even pattern of spend regionally in the pre-recession years.
The pattern now has very much a north-south divide flavour to it. And we should note that homeownership in London is less common than elsewhere, so the bulk of the spending comes from a smaller proportion of the households.
For me, however, the most informative is the graph showing spending by household composition. This suggests that retired couples are increasingly driving the home improvement market. And given the expectations that pensioners may well continue to be the most protected group while austerity reigns, this trend may be set to continue.
One encouraging thought is that perhaps with savings rates so low, older folk are spending more heavily on improving the energy efficiency of their homes.
There is one gem from the family spending data that I haven’t charted. It suggests that students have almost tripled their spending on home improvements in recent years. Why? I really don’t know. but intriguing nonetheless.
So, the next time you visit Homebase or B&Q or Wickes and you are puzzled by the number of pensioners and students, you can be comforted in the fact that it is not your imagination. Home improvers are getting older and there appear to be more students among them.
Brian Green is an independent analyst, commentator and consultant working in construction, housing and property


No comments yet