It鈥檚 time to celebrate (cautiously), as data from Experian Economics shows that construction activity in Q3 2013 was the greatest since 2011 and the UK GDP growth looks sustainable as well
01/ Overview
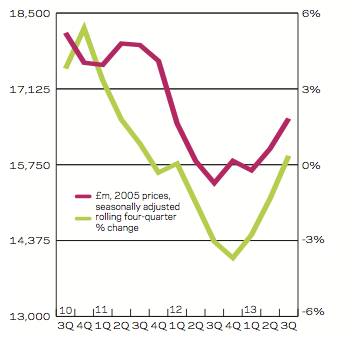
Construction activity picked up by 3% in the three months to September 2013, reaching 拢28.9bn (2010 prices), the highest quarterly total since corresponding three months of 2011.
Overall, new work saw growth of 3%, outperforming repair and maintenance (R&M) which saw a moderate 1% increase. Of the new work sectors the largest upticks were seen in private housing and commercial construction, at 4% and 7% respectively. All the remaining new work sectors saw growth in output; the only exception was industrial construction, falling 7% in the aforementioned period.
UK GDP was estimated to have grown by 0.8% quarter-on-quarter in the three months to September of 2013, following on from a 0.7% expansion in the previous quarter. Growth at this level suggests that the recovery that took hold at the beginning of the year is sustainable. The construction sector saw growth estimates revised downwards from 2.5% to 1.7%, while overall services expanded by 0.7%.
In the third quarter of 2013, the most significant upticks were seen in private housing and commercial construction with annual increases of 17% and 14% respectively. The former rose to 拢4.5bn and the latter to 拢5.7bn. Public housing (拢1.1bn) also saw an increase in activity, up 9% on the corresponding period of the previous year.
Industrial construction activity fell for the fourth straight quarter to 拢759m, down 10% on the corresponding figure for 2012; it was also the lowest quarterly total on our 16-year records. Activity also edged downwards in both the infrastructure and public non-residential sectors by 1% and 2% respectively.
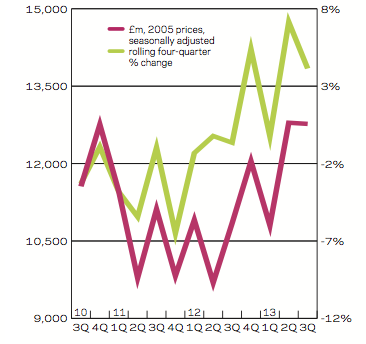
Total new work orders rose to 拢12.8bn (2005 prices) in the third quarter of 2013, an increase of 18% when compared with the corresponding period of 2012, although the figure did remain unchanged quarter-on-quarter.
Double-digit increases were seen in the majority of new work sectors. The strongest upswings on an annual basis were seen in the public housing (拢1.1bn) and private housing (拢2.9bn) sectors, at 78% and 32% respectively. Public non-residential construction was the only new work sector that saw a dip in orders over this period, with a 4% contraction to 拢1.8bn.
02/ New work output
03/ R&M output
04/ New work orders
05/ 2014-16 forecast
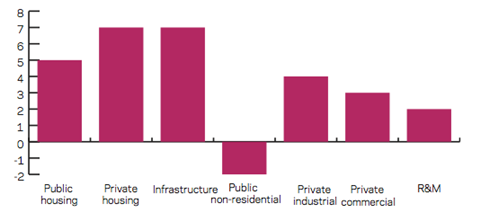
The chart outlines the sectoral forecasts for 2014-2016. Over the forecast period we expect to see growth in the majority of new work sectors, with the largest upticks in the private housing and infrastructure sectors, both at 7%. We also expect notable growth in the public housing (5%) and industrial sectors (4%). Nevertheless we still anticipate a fall in activity of 2% in the public non-residential sector, on the back of persistently low public spending.
06/ Regional new work output
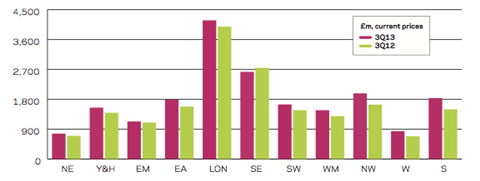
Output in 10 out of 11 regions and devolved nations was higher in the three months to September 2013 than it was in the corresponding period of 2012. Yorkshire and Humberside, the East of England, South-west, West Midlands, North West, Wales and Scotland all saw double-digit growth. On the other hand, the South-east was the only sector to see a fall in new work activity, with 4% contraction.
07/ Regional R&M output
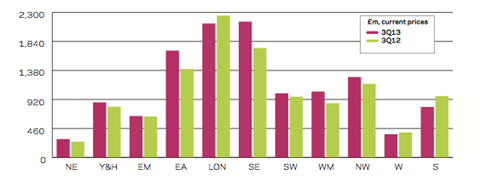
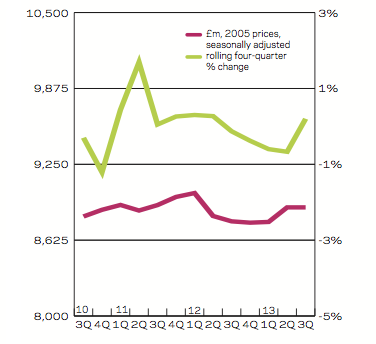
The repair and maintenance (R&M) sector saw growth in eight out of 11 regions and devolved nations. On an annual basis the South-east and West Midlands saw the strongest increases of 24% and 22% respectively. Greater London, Wales and Scotland all saw declines with the latter seeing a particularly sharp contraction of 18%.
08/ Regional new work orders
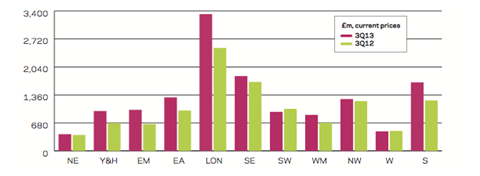
New work orders in the third quarter of 2013 picked up in the majority of regions and devolved nations. The East Midlands, Yorkshire and Humberside and Scotland all saw sharp upswings of 54%, 44% and 36% respectively. In contrast, new work orders fell in the South-west (7%) and Wales (2%).


No comments yet